The graphs below were generated using an auxiliary patch to record value of the high-resolution clock over the last 8Kq timer interrupts and make these samples available through the file /proc/scx200hr. A copy of this file was made ever 6 seconds over a 5 minute period and then combined using cat, sort and uniq. These samples were collected both when the CPU was idle and when it was under load.
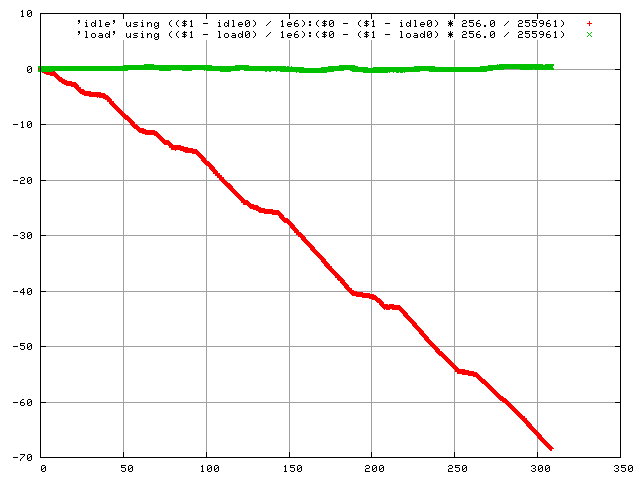
This first graph compares the rate of interrupts timers when the CPU is idle (red) and when it is under load (green). The x-axis represents time, in seconds, as measured by the high-resolution timer. The y-axis shows the difference between the number of timer interrupts encountered compared to the number we would expect to see if the PIT frequency were correct. In other words, a point is above the zero line indicates that the PIT is running fast, a point below the zero line indicates that it is running slow.
As you can see, when the CPU is idle, it loses time (around 65 interrupts over 5 minutes), but when it is kept busy it keeps reasonably good time. In fact, the busy CPU actually appears to be running slightly fast.
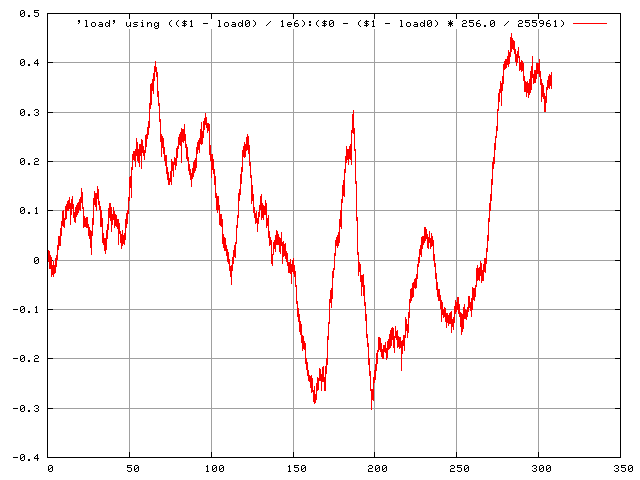
This second graph is a close-up of the green line from the first graph. I do not know exactly what is causing the fluxuations in the graph, but bear in mind that the entire y range corresponds to less than one timer tick. The interesting thing about this graph is that it shows that the PIT can run fast for several seconds at a time. Occasionally it spikes for long enough that it becomes necessary to pretend that an interrupt didn't occur in order to keep the system time from drifting.